What Is an Identity Graph? How Anonymous Visitors Get Matched to Real People
An identity graph is the database that turns scattered signals like cookies, emails, device IDs and IP addresses into one real person or company. This guide breaks it down node by node: how a graph matches an anonymous visitor to a name, the difference between deterministic and probabilistic matching, why every graph decays over time, and why a B2B graph is a fundamentally harder problem than the consumer graphs that hit 99% match rates.
Last updated: September 4, 2026
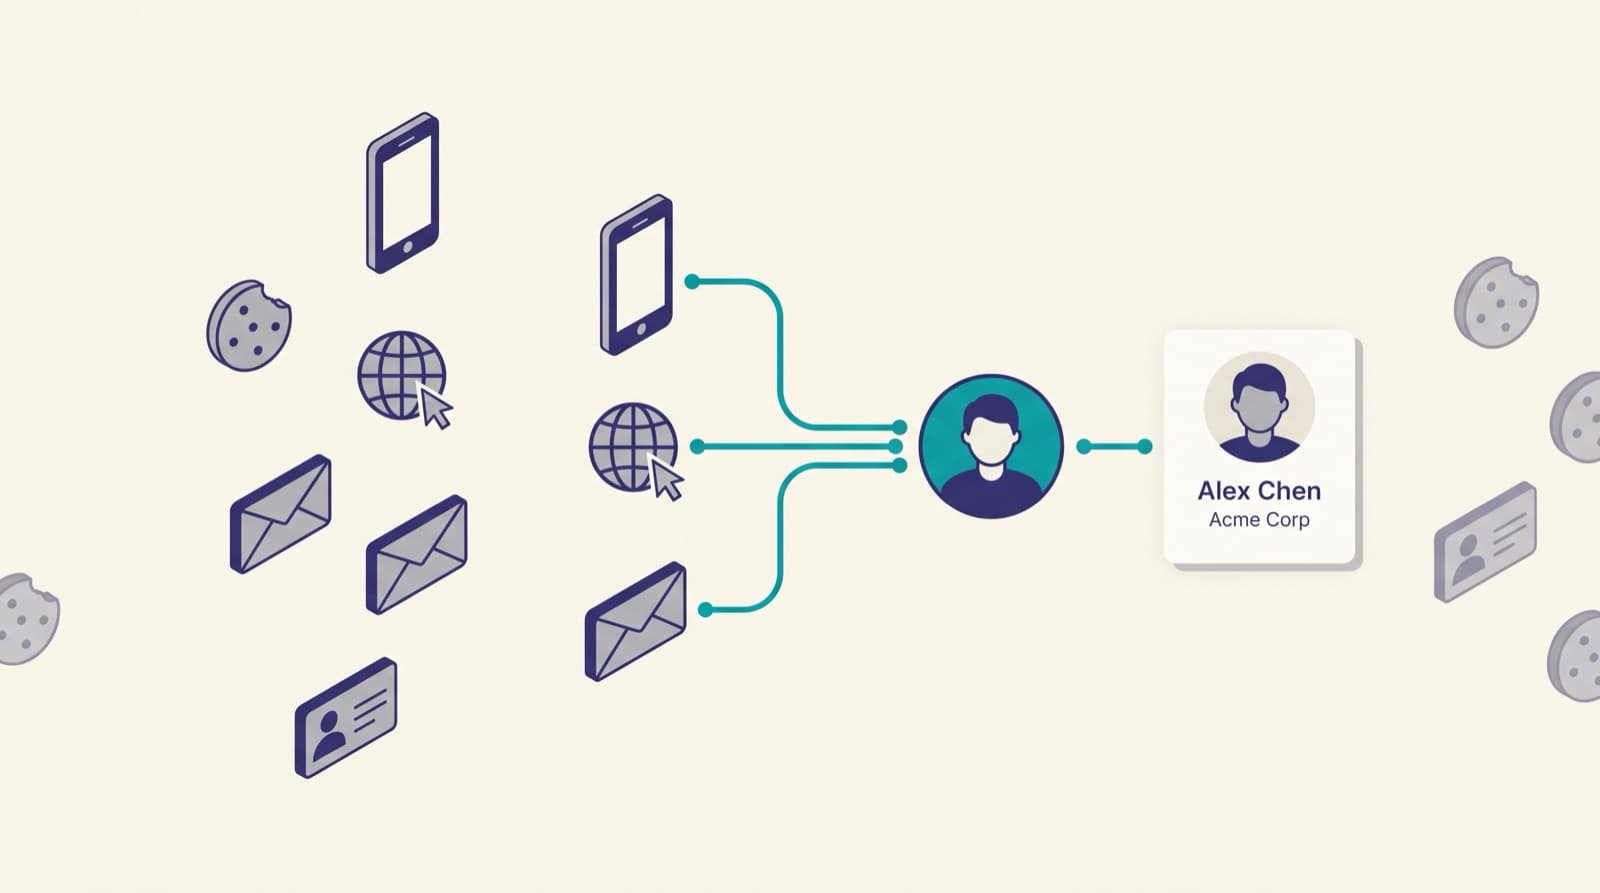
An identity graph is a database that connects the scattered identifiers belonging to one person or company: email addresses, cookies, device IDs, IP addresses, login events. Its job is to resolve a fragmented trail of signals into one identity. It is the engine behind website visitor identification — what turns the traces an anonymous visitor leaves into a name.
Most explanations of identity graphs either wave at the concept ("it connects the dots") or drown you in CDP jargon. Both leave out the one thing a buyer has to know before acting on a match, which is how confident it is and why.
A graph never hands you certainty. It hands you its best guess, and the quality of that guess depends entirely on what the graph was built from and how it decides that two identifiers belong to the same person. Once we understood that, every match-rate claim in the category started making sense, including the ones I had previously found impressive.
So this post breaks the identity graph down node by node, using the same vocabulary we use internally when we argue about our own confidence thresholds. It's the mechanics deep-dive for the pillar guide, which covers the whole category, and the companion to the five methods of identifying visitors. If your traffic is consumer ecommerce rather than B2B, the graph works differently enough that it gets its own treatment in our ecommerce visitor identification guide.
KEY STATS
- Around 98% of website visitors are anonymous and never identify themselves (Twilio Segment, 2026)
- Only about 3% of B2B website visitors fill out a form (6sense, 2022)
- Identity graphs match 2 ways: deterministic (an exact match on a verified identifier) and probabilistic (a statistical inference from several weaker signals). Loosening the required probabilistic confidence from 90% to 50% roughly doubles a published match rate without adding a single verified match
- Person-level resolution through a third-party graph realistically lands around 15-20% of US traffic, while published vendor claims run as high as 55% (compiled July 2026)
- Independent testing across 12 platforms puts realistic person-level resolution at 5-20%, and one category glossary notes that any tool claiming 80%+ at the person level is leaning heavily on probabilistic guessing (MarketBetter; Leadpipe, 2026)
- LiveRamp reports a 99.5% match rate on full-PII consumer data, measured independently by Comscore. It is a B2C ceiling with no B2B equivalent (LiveRamp/Comscore CustomIQ, Q1 2026)
- B2B contact data goes stale at somewhere between 22.5% and 30% a year, driven mostly by people changing jobs (MarketingSherpa via HubSpot; ZoomInfo, 2026)
- Data sourced from vendor documentation, published match-rate disclosures, and platform benchmarks, compiled July 2026
What's in this guide:
- What is an identity graph?
- How does an identity graph match an anonymous visitor to a real person?
- Deterministic vs probabilistic matching
- Identity graph vs identity resolution: what's the difference?
- Why identity graphs decay
- Why B2B identity graphs are harder than B2C
- Frequently asked questions
What is an identity graph?
Picture everything a single buyer touches online over a year. They read your blog on a work laptop, click a LinkedIn ad on their phone, open a newsletter in Gmail, visit your pricing page from a coffee shop's wifi, and eventually log in from the office.
To your analytics, that is five or six different anonymous visitors. To an identity graph, it's one person, provided the graph holds enough connections to prove it. That proviso is where I'd focus every question you ask a vendor.
The graph stores all of this as nodes and edges. A node is a single identifier — a cookie ID, a device fingerprint, an IP address, a hashed email, a LinkedIn URL, a login event — and an edge is a claim, with a confidence attached to it, that two of those nodes belong to the same person or the same company. When you log in from that office laptop, the graph draws a strong edge between your login, which it trusts, and the device you're using, which it now trusts a little more. Over time those connections accumulate into a cluster, and as far as we're concerned the cluster is the person.
There are two kinds of graph doing this work:
- A first-party identity graph is one you build from your own data: your logins, your CRM records, your own cookies set on your own domain. Ours is small but clean, because we own every connection in it and know exactly where it came from.
- A third-party identity graph is a massive external database assembled from publisher networks, data co-ops, and partnerships. It reaches far more people than we ever could alone, but we didn't build those connections and can't fully audit them.
Most visitor identification tools query a third-party graph, because that is the only way to resolve someone who has never been to your site before. We query one too, on top of a first-party foundation. That reach is also exactly where the accuracy problems live.
I can tell you who drew every claim in our own graph, and on what evidence. I can't tell you that about the third-party graph we query on top of it, and no vendor querying one can tell you either.
How does an identity graph match an anonymous visitor to a real person?
The resolution happens in four steps, and it takes milliseconds.
1. An anonymous visitor arrives. Someone lands on your site with no name attached. All you have is a browser session.
2. Signals get captured. A pixel or a server-side script collects whatever identifiers the visit happens to expose, which usually means the IP address, a device fingerprint, any first-party cookie you've already set, and, where some prior interaction allows for it, a hashed email address. None of that is a name yet. It's raw signal.
3. The graph is queried. Those captured signals are matched against the identity graph. The graph looks for a node cluster that already contains one or more of them and asks: which known person or company do these belong to?
4. A contact is returned, or it isn't. If the graph finds a confident match it returns the resolved identity: a name, often a company and title, sometimes a verified work email. That contact then gets enriched and routed into your CRM.
If it doesn't find a confident match, the visitor stays anonymous. No graph ever resolves everyone. The share it does resolve is your match rate, and how that rate gets calculated is the subject of Post 4 on match rates.
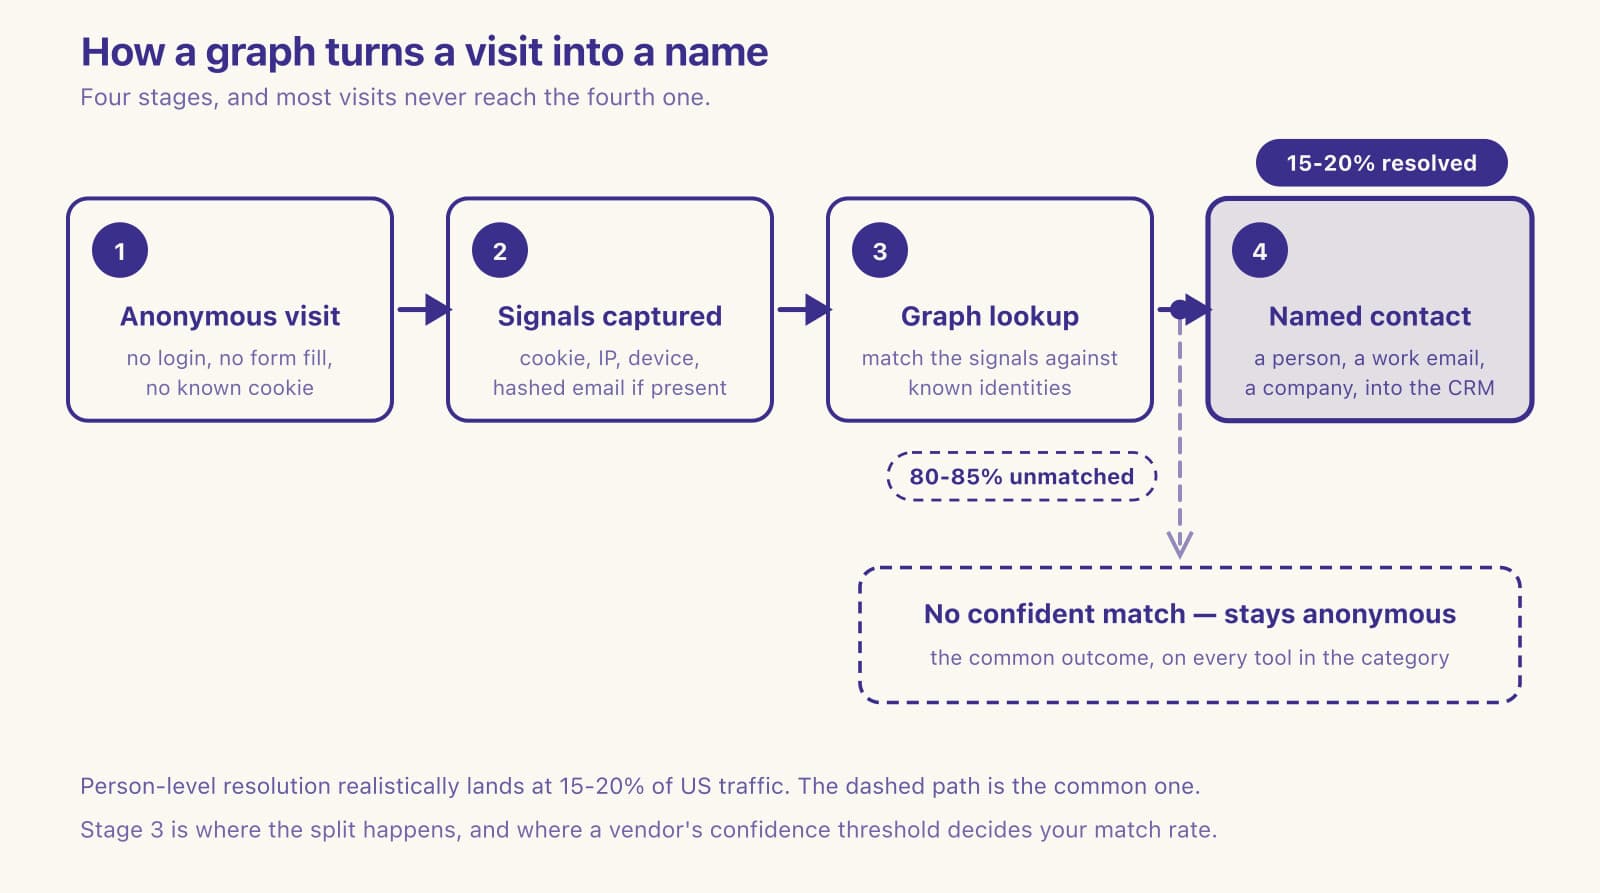
The single most important word in that flow is "confident." The graph is never returning a fact. It's returning a match with a confidence level attached to it, and whether that confidence came from an exact match or from an educated guess is the whole difference between a lead you can act on and one that will embarrass a rep. We set our threshold deliberately high and accept the smaller number that follows.
We argued about where to set it for longer than we spent building the query, because every point you drop it by buys reach and sells accuracy, and I've never found a vendor in this category who publishes where theirs sits. Ask anyway. The answer, or the absence of one, tells you what their match rate actually means.
Deterministic vs probabilistic matching
Every edge in an identity graph is drawn one of two ways, and this is the distinction that separates real identity data from expensive guesswork.
Deterministic matching links identifiers through an exact match on something stable and unique, most often a hashed email address or a login event. If the same hashed email turns up in two places, the graph knows with near-certainty that they're the same person, because email addresses never get shared by accident.
This is the high-confidence, verified path that we build Signal on, and it's also much scarcer than the alternative, because it requires that the person handed over a stable identifier somewhere the graph could actually see it happen.
Probabilistic matching infers a connection from a bundle of weaker signals such as IP address, device type, browser configuration, geographic location and time-of-day patterns, none of which proves identity on its own. Two people in the same office share an IP. Families share laptops. Neighbors on the same carrier share a subnet. But stack enough of them together and a model can estimate that a session probably belongs to a particular person, then hand back a confidence score of, say, 68%. We see plenty of those. It's a statistical guess. A useful one, and we use them, but a guess.
| Deterministic | Probabilistic | |
|---|---|---|
| Based on | An exact match on a stable, unique identifier (hashed email, login) | A statistical inference from several weaker signals (IP, device, location, behavior) |
| Confidence | Near-certain, verified | A probability score, not a fact |
| Coverage | Lower; needs a stable identifier to exist | Higher; works from signals every visit leaves |
| Failure mode | Misses people who never surfaced a hard identifier | Mismatches: wrong person, household member, shared IP |
| Best used for | The core of a trustworthy match | Extending reach, clearly labeled as inferred |
The takeaway: Deterministic matching keys on an exact hit against a stable identifier such as a hashed email or a login, which produces a near-certain result but lower coverage. Probabilistic matching infers identity from IP, device, location and behavior, extending reach but returning a probability score rather than a fact. Its failure mode is a mismatch: the wrong person, a household member, or a shared IP.
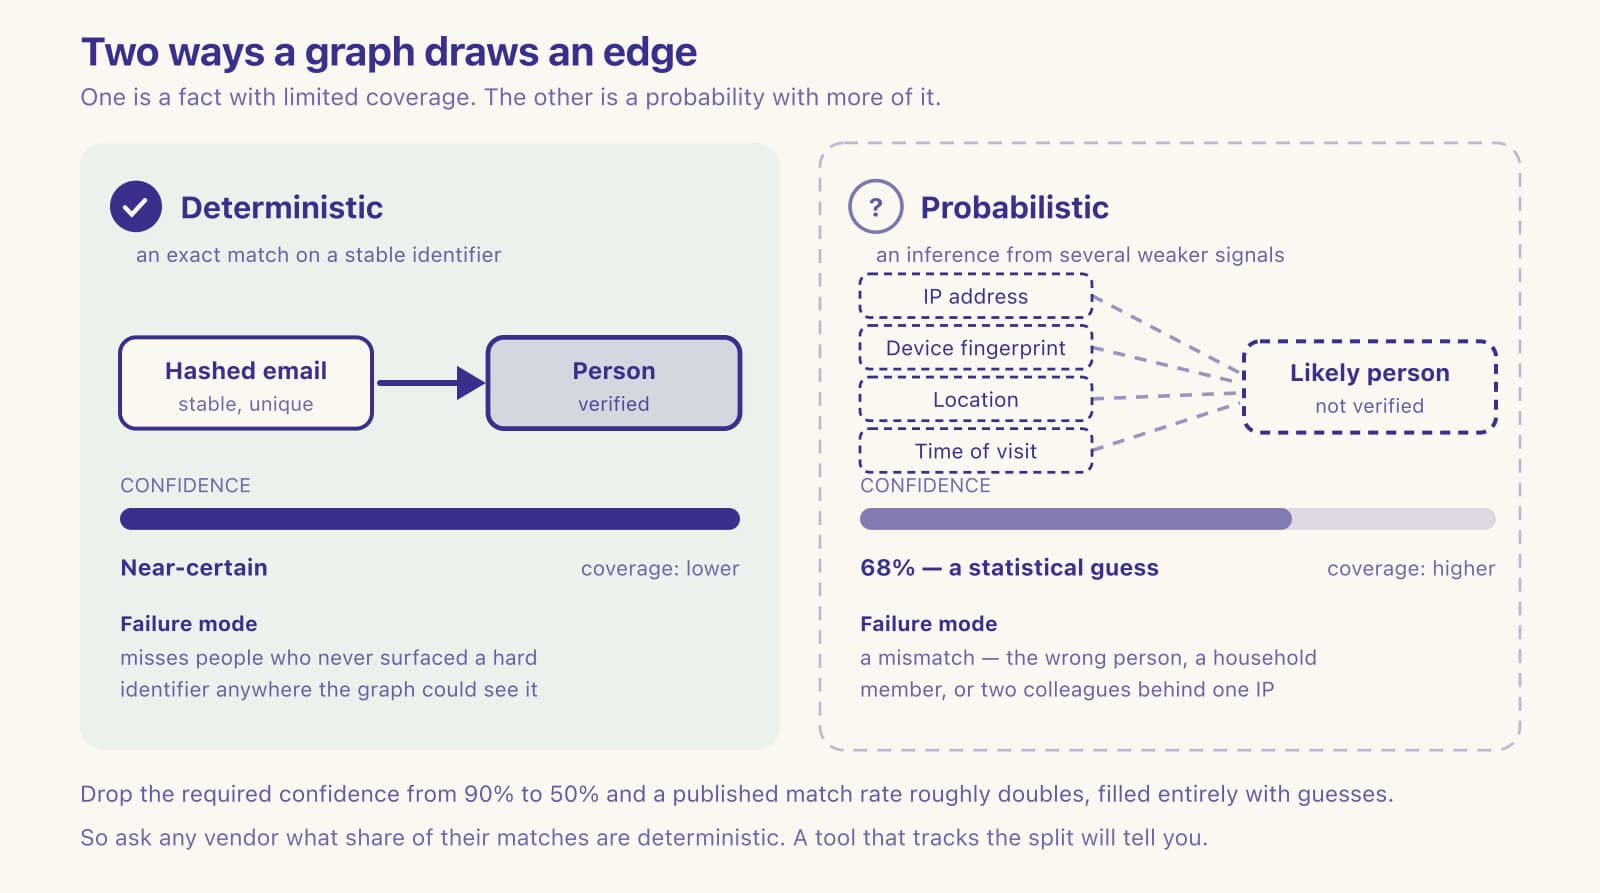
A vendor can inflate a match rate simply by loosening the probabilistic threshold: drop the required confidence from 90% to 50% and the "match rate" roughly doubles overnight, with the extra half filled entirely by guesses.
So ask any vendor what share of their matches are deterministic versus probabilistic. Ask us the same thing. Any tool that tracks the split will tell you, and one that won't answer is either not measuring it or would rather you didn't do the arithmetic yourself.
The people who build these systems for a living usually describe the trade-off in the same terms, and they include the part vendors typically leave out, which is that a probabilistic edge gets worse as it ages:
"Probabilistic matching algorithms are less accurate than deterministic ones because they guess at the connections among various data sources. […] Because a customer's behavior and preferences can change, the matches may grow less accurate with time." — Anthony Rotio, Co-CEO, GrowthLoop (GrowthLoop)
Leadpipe's own glossary puts it plainly: any tool claiming 80% or higher at the person level "is either measuring something unusual or leaning heavily on probabilistic guessing, which hurts accuracy."
I treat that as a rough dial. The higher a person-level number climbs above the high teens, the more of it is inference rather than verification, and that holds for our number just as much as for anybody else's.
Identity graph vs identity resolution: what's the difference?
These two terms get used interchangeably, but they're not the same thing.
Identity resolution is the process: the act of taking fragmented signals and working out which real person or company they belong to. An identity graph is the database that makes that process possible, the stored web of nodes and edges the resolution runs against. One is an action, the other is the thing the action reads from.
Identity resolution software is the category of tools that build, maintain and query those graphs, and we sit in it. In the B2C and CDP world, that's platforms like Twilio Segment, LiveRamp, Tealium, and Amperity, which unify customer records across channels, almost all of it consumer-focused or company-level. In B2B visitor identification, the "identity resolution software" is whichever tool queries a graph to put a name to your anonymous traffic, which is the job we do. We compare ourselves against the other B2B options in Post 7 on the best visitor identification tools.
According to Twilio Segment's 2026 explainer, identity resolution is what lets a business unify scattered customer data into a single view of a person, and the graph is simply where that view is physically stored. Keep the two straight and vendor pitches get considerably easier to parse. When someone sells you "identity resolution," ask to see the graph underneath it, and ask when it was last rebuilt.
Why identity graphs decay
Graphs are perishable. A graph you licensed eighteen months ago isn't the graph you're querying today, even though the invoice looks identical.
The decay has three main drivers, and we fight all three of them continuously.
People change jobs. A work email that mapped to one company last quarter maps to a different one now, and every claim built on that email is quietly wrong until somebody corrects it. We've never found two sources that agree on how fast this happens. HubSpot's decay model, built on MarketingSherpa research, puts B2B contact data at 2.1% lost per month, which annualizes to 22.5%, while ZoomInfo's own analysis says 25-30%.
I take the range at face value: roughly a quarter of what any graph knows about your market is wrong within a year. We plan for that rather than argue with it.
While I was checking that figure I caught us misquoting a different one, and it's precisely the same failure in miniature. Twilio Segment reports that around 98% of website visitors stay anonymous. Their exact wording is "around upwards of 98%," which is a floor.
An earlier draft of ours rendered it as "up to 98%." That turns their floor into a ceiling and makes the anonymous share sound smaller than Twilio actually measured it — and since the size of that share is most of the reason anyone buys a tool like ours, we had quietly understated our own case. I corrected it across three posts. I read quantifiers before numbers now.
Cookies get cleared and blocked. Safari and Firefox block third-party cookies by default, and Google reversed its plan to remove them from Chrome in April 2025 — so connections keep breaking on part of your traffic and holding on the rest, faster than most graphs rebuild them. Because a broken connection never reports itself, the graph keeps returning the cluster it built beforehand. That failure is silent by construction. Post 8 is the technical treatment.
Device fingerprints drift. Chrome and Safari ship updates, people buy new iPhones, and the signals that anchored a probabilistic match simply stop lining up. This one is invisible until you audit it.
This is why the raw size of a graph, the number vendors most love to advertise, tells you almost nothing useful. A graph holding two billion profiles that hasn't been refreshed in a year is worse than a much smaller one rebuilt every month, because a stale match never announces itself as stale.
It comes back looking exactly like a fresh one, with the same confident name attached, and then you email the wrong person at the wrong company. So when you evaluate a graph, ask when it was last rebuilt and who it was built from before you ask how many profiles it holds. That is the order we ask our own suppliers in.
Some vendors will answer that second question directly, and we keep track of which ones do. Vector, whose graph powers person-level identification inside Common Room, draws a hard geographic boundary around what it builds from:
"It's why Vector is geofenced to only operate in the United States and doesn't build any of its identity graph with information outside of the US." — Joshua Perk, Cofounder and CEO, Vector (Common Room)
Vector is describing a ceiling on its own coverage rather than a feature, and I'd generally rather buy from a supplier that volunteers one. When a graph claims global person-level reach and names no geographic limit at all, ask which jurisdictions it was actually built in, because GDPR makes EU person-level resolution a different legal problem from US resolution rather than a slightly harder version of the same one.
Making a match rate look big is not hard. You count the shaky matches alongside the solid ones and hope nobody checks. What we kept running into is that the customer does check. They email the contact, it bounces, or it turns out to be someone who left that company in March, and after two or three of those they stop trusting the rest of the data too. That is a much more expensive problem than a smaller number on a pricing page. So we return fewer matches and label which ones are verified. It costs us some deals at the demo. It costs us fewer at renewal. — Bob Thordarson, Geysera CEO
Why B2B identity graphs are harder than B2C
B2B identity resolution is a fundamentally harder problem than B2C, and the numbers reflect that clearly once you separate them.
Consumer identity graphs are enormous and dense. They have been built up over decades from consumer PII, loyalty programs, purchase histories and vast advertising co-ops, all of it tied to relatively stable identifiers like a personal email address or a home address that most people keep for years at a stretch. That's why LiveRamp can report a 99.5% match rate on full-PII consumer data, a figure Comscore measured independently rather than one LiveRamp published about itself. The consumer graph is deep, and the identifiers barely move. If your business is ecommerce, that density is working in your favor, which is why the ecommerce visitor guide tells a more optimistic story than this one.
B2B is the opposite in every single dimension. A useful B2B match has to connect three things that live in different places — the person, their employer, and their role — and then it has to attach a work email rather than a personal one.
Work email is precisely the identifier that decays fastest, because it dies the moment somebody changes jobs. So the graph is sparser, the identifiers are far more volatile, and a named individual at a specific company, which is the only thing you actually wanted, turns out to be the hardest node of all to resolve confidently. We've never found a way around that, and I'm suspicious of anyone who claims they have.
That gap between a 99.5% consumer ceiling and the 15-20% B2B reality is easily the biggest source of misleading claims in this space. A vendor who quietly borrows consumer-graph logic, or blends company-level matches into a "person-level" number, can advertise 40% or more and still technically point at data when challenged.
Published B2B person-level claims now reach 55%. None of them answer the question a B2B buyer is actually asking.
The cleanest example of that blend is arithmetic you can check yourself in about a minute. RB2B's support documentation lists person-level identification at 40-45% and company-level at 30-35%, then describes overall identification as 70-80%. That is simply the two figures added together, on a page that elsewhere states they're independent processes. About half of that headline is the graph telling you an organization visited, which is a much easier question than naming a human. Post 4 takes the whole category apart on this point and compares the published claims of 15 B2B vendors.
One thing about that 15-20%: we didn't measure it ourselves.
We compiled it in July 2026 from what vendors publish about themselves, and I'd apply precisely the suspicion to our range that I'm asking you to apply to theirs. The only difference I'll claim is simply that we've told you where ours came from.
Frequently asked questions
What is an identity graph?
An identity graph is a database that links the scattered identifiers belonging to the same person or company (cookies, device IDs, IP addresses, hashed emails, logins) so fragmented signals resolve to one identity. It's stored as nodes (individual identifiers) and edges (connections between them), and it's the engine that lets a visitor identification tool put a name to anonymous website traffic.
What is the difference between an identity graph and identity resolution?
Identity resolution is the process of working out which real person or company a set of signals belongs to. An identity graph is the database that process runs against. Resolution is the action; the graph is the stored web of identifiers and connections that makes the action possible. Identity resolution software is the category of tools that build and query those graphs.
What is the difference between deterministic and probabilistic matching?
Deterministic matching links identifiers through an exact match on a stable, unique identifier like a hashed email or a login, producing near-certain, verified results. Probabilistic matching infers a connection from weaker signals like IP address, device, location and behavior, then returns a confidence score rather than a fact. Deterministic is more accurate; probabilistic reaches more traffic but introduces mismatches.
How accurate is identity graph matching?
It depends entirely on whether a match is deterministic or probabilistic, and on how fresh the graph is. Deterministic matches on a verified identifier are near-certain. Probabilistic matches are statistical estimates that can be wrong. In B2B, person-level resolution realistically lands around 15-20% of US traffic, and independent testing across 12 platforms puts it at 5-20%, well below published vendor claims that reach 55%.
What is identity resolution software?
Identity resolution software is the category of tools that build, maintain, and query identity graphs to unify fragmented data into a single view of a person or company. In B2C and CDP contexts, examples include Twilio Segment, LiveRamp, and Tealium. In B2B visitor identification, it's the tool that queries a graph to attach a name, company, and work email to anonymous website visitors.
Why do identity graphs go stale?
Because the identifiers they're built on keep moving. People change jobs, so work emails point to the wrong company. Estimates of B2B contact decay run from 22.5% a year (HubSpot's model, built on MarketingSherpa research) to 25-30% (ZoomInfo). Cookies get cleared and blocked, breaking edges. Device fingerprints drift as browsers and hardware update. A stale match looks identical to a fresh one, which is why freshness matters more than a graph's advertised size.
Do B2B and B2C identity graphs work the same way?
No. Consumer graphs are dense and stable, built on personal emails, purchase histories and huge co-ops, which is how LiveRamp reports a 99.5% match rate on full-PII consumer data, independently measured by Comscore. B2B graphs must connect a person, their employer, their role, and a work email, the identifier that decays fastest. That's why B2B person-level match rates realistically sit around 15-20%, nowhere near the consumer ceiling.
Continue the Series
This is Post 3 in Geysera's 13-part series on B2B anonymous visitor identification.
- Post 1 — Anonymous website visitor identification: the complete 2026 guide (pillar)
- Post 2 — How to identify anonymous website visitors: 5 methods and what each delivers
- Post 4 — Match rates decoded: why 40%+ person-level claims are usually fiction
- Post 8 — Third-party cookies didn't die. The deprecation did.
- Post 7 — The best website visitor identification tools (2026)
Sources
- Twilio Segment — Identity resolution: what it is and how it works
- LiveRamp — What is an identity graph?
- LiveRamp — 99.5% match rate on full PII with complete address data (measured by Comscore CustomIQ, Q1 2026)
- HubSpot — Database Decay Simulation (2.1%/month, 22.5%/year, per MarketingSherpa)
- ZoomInfo — How to improve B2B data quality (25-30% annual contact decay)
- Leadpipe — What is match rate in visitor identification?
- MarketBetter — 12 best B2B website visitor identification tools 2026, with tested match rates
- RB2B — Contact-level identification (support documentation)
- 6sense — Only 3% of web visitors fill out forms
- Factors.ai — Website deanonymization: B2B visitor identification in 2026
- Demandbase — The State of Account Identification
- GrowthLoop — Deterministic vs probabilistic matching (Anthony Rotio, Co-CEO)
- Google Privacy Sandbox — Next steps for Privacy Sandbox and tracking protections in Chrome (April 22, 2025)

Co-Founder and CEO
Bob Thordarson is CEO and Co-Founder of Geysera, a serial entrepreneur with 25+ years and five co-founded ventures, including Cequint (acquired by TNS in 2010 for $112.5M) and Consumerware (acquired by ParkerVision). A graduate of the University of Washington and MIT Entrepreneurial Masters Program, based in Seattle, he serves on the boards of DRY Soda Co. and the Entrepreneurs' Organization Seattle chapter. He is an expert in retention marketing email systems and methodology for ecommerce and B2B brands — measured by incremental revenue, not vanity metrics.